
It's the question we're asked more than any other right now. Rates have gone up four times this year, every headline says the market is falling, so surely the sensible thing is to wait and buy later when it's cheaper. Fair enough. But almost everybody is thinking exactly that at exactly the same moment, which is the first clue that waiting might not be the edge it feels like.
You don't have to guess whether people are sitting on the fence. It shows up in the data, and the shape of it is unusual.
Read those together, because separately they mean nothing. Fewer homes are being listed than a year ago, and yet there's a quarter more stock on the market. Sellers haven't flooded anything. The stock is piling up because buyers have stopped transacting.
That gap between fewer listings and more stock is the fence, and you can count it. Roughly 85,000 homes are sitting on the market while people wait to see what happens next.
What the fence actually looks like
Underneath the numbers is a change in how buyers are thinking. For three years the dominant emotion in Australian property was the fear of missing out. Today it's the fear of overpaying. Same person, same house, opposite instinct, and the whole market re-prices around it.
Here's what that means in practice, and it's the part the headlines skip. When stock sits and buyers hesitate, vendors who actually need to sell start meeting the market. Those are the deals. They're available now, quietly, to people in a position to transact. They won't be available in a crowd.
Why they're stuck, in numbers
Plenty of people on the fence aren't there by choice. The maths has moved under them.
That's roughly how much borrowing capacity the typical Australian buyer has lost this year. Each 0.25 percent move costs an average earner around $11,200. Four moves, and a loan that was approved in January no longer stretches to the same house.
There are two other brakes on top of that, and they matter for how fast things can turn back.
The first is the serviceability buffer. Lenders have to assess you at your actual rate plus three percentage points, so a borrower on roughly 6.5 percent is being tested at close to 9.5 percent. The second is newer and less discussed. Since 1 February 2026, banks have been capped at writing no more than 20 percent of new mortgages to borrowers whose total debt exceeds six times their gross income.
That second one is genuinely important, and we'll come back to it, because it's the single best argument against our own position.
What interest rates can and can't fix
The official reason for four rate rises is inflation. That part is true. The part worth understanding is what kind of inflation it is, because it changes how long this lasts.
Most Australians can feel that they're not spending more because they want to. They're spending more because they have no choice. Look at where the increases actually landed.
Raising the cash rate works by reducing how much households can borrow and spend. It's a demand tool, and it's reasonably good at cooling an economy where people are spending freely because money is cheap. It can't lower the price of diesel, it can't reverse a decision to end an energy rebate, and it can't make beef cheaper.
You can't raise interest rates to fix the price of fuel. You can only make everyone poorer until they buy less of it.
We're not saying the Reserve Bank has no job to do here. We're saying that when a meaningful share of the inflation is coming from supply and from policy rather than from demand, the lever being pulled is a blunt one, and the timing of the turn gets much harder to predict. If you want the longer version of why rates went up, we wrote that one here.
We've seen this playbook before
This is the part that should matter most to anyone deciding whether to wait, because Australia ran this exact sequence seven years ago and the record is clear.
Values fall 8.4%
Twenty months of decline. The commentary says the boom is over.
The first cut
Then again in July, and again in October. The cash rate goes 1.5% to 0.75%.
Fourth month up
National values rising again, about four months after that first cut.
Sydney 19.6%
Annualised over three months. Melbourne at 21.6% on the same measure.
Twenty months of falling values, then a turn inside a single quarter, then a run at close to 20 percent annualised. Not a gentle recovery. A snap.
The mechanism is simple enough. A rate cut doesn't persuade one buyer at a time. It restores borrowing capacity to every buyer in the country on the same afternoon. All the people who spent a year telling themselves they'd buy when things settled down arrive at the same open home, and they're bidding against each other for the stock nobody wanted three months earlier.
It's the second cut, not the first
One cut gets reported. Two cuts get believed. That's the distinction we'd make, and it's why we're more interested in the shape of the turn than in picking a month.
The first cut arrives and most people treat it as a one off, or wonder whether it signals something worse. The second one tells the market a direction has been set. That's when the snowball starts rolling, and that's when the fence empties.
Somewhere in there, two cuts land, and the behaviour you can see in today's listings data reverses. Which brings us to the thing almost nobody is factoring in.
The cost nobody is pricing in
When confidence comes back, it won't come back politely. People will rush at new builds, and at buying older homes to knock down and rebuild. Everyone will want the same thing in the same eighteen months.
Australia has run that experiment too, and it didn't go well.
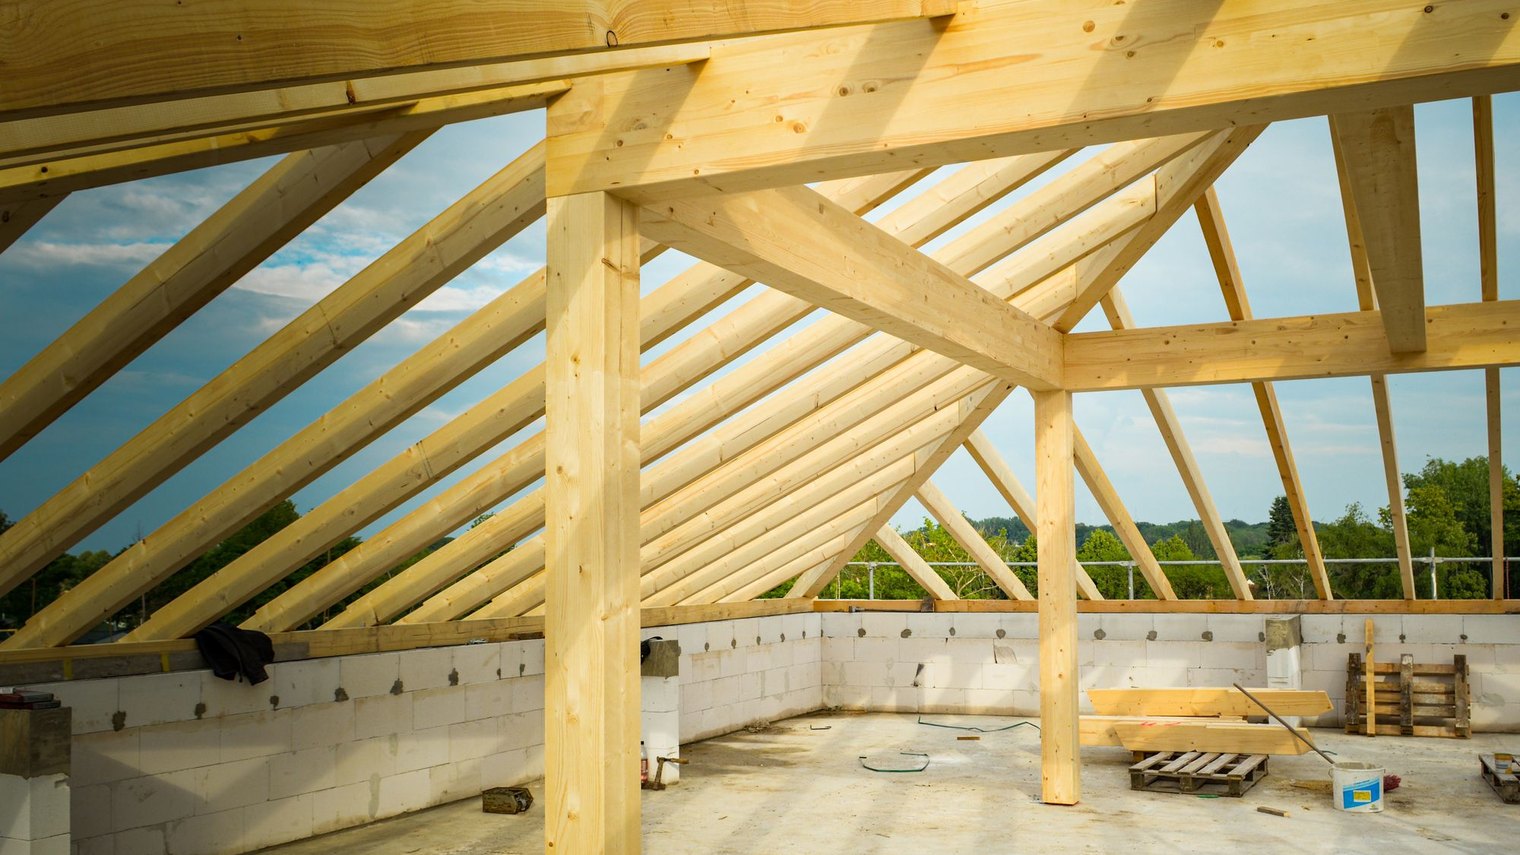
HomeBuilder was announced in June 2020. More than 137,000 projects went into an industry that had no capacity to absorb them, and the result wasn't a construction boom so much as a construction pile up. Build costs rose 30 to 40 percent while builders sat on fixed price contracts they'd signed before any of it happened.
The damage ran for years afterwards. Construction accounted for 28 percent of every company liquidation in Australia in 2021-22. Insolvencies didn't peak until 2024, two full years after material costs started easing, because builders were still working through contracts priced in 2020 and 2021. Dwellings under construction peaked at 104,315 in the March quarter of 2023. The industry is still carrying the scar tissue.
Waiting doesn't just cost you the discount on the land. It can cost you the price of the build as well.
So if your plan is to wait for confidence and then build, understand what you're actually queuing for. You'll be competing for trades and materials with everybody else who had the same idea, in an industry that has spent four years rebuilding its capacity and still hasn't got it back. Prices rise out of scarcity, not just out of optimism.
What a recovery actually looks like
If you want a sense of scale for what a market does when it has a reason to move, Brisbane is the obvious case. Three years, compounding.
That's the honest version of the argument. Even if values fall another 10 percent across the country from here, a market that compounds at those sorts of rates once it turns makes that back quickly. The fall is the thing everybody can see. The recovery is the thing that happens while they're still arguing about the fall.
What would make us wrong
We'd rather put this in writing than have you find it out on your own.
- The debt to income cap. This is the strongest argument against us. Since February, banks can only write 20 percent of new loans above six times income. When rates fall, that cap still throttles how fast borrowing capacity actually returns. The 2019 recovery had no such brake. This one does.
- Inflation not behaving. If energy and fuel stay high, the Reserve Bank holds longer than anyone expects and the turn slides into 2028. Our timing would simply be wrong.
- Rates going further up first. More rises before any cuts would extend the squeeze and hurt anyone who bought at the edge of their capacity.
- The 2027 tax changes. From 1 July 2027, negative gearing is restricted to new builds and the capital gains model changes. None of it is legislated yet, and the detail can still move.
- History is a guide, not a promise. 2019 is the closest comparison we have. It isn't the same market, the same debt levels or the same global backdrop.
So, should you wait?
If the honest answer is that you can't comfortably carry a property at today's rates, then yes. Wait. Build your deposit, fix your borrowing position, and come back when the numbers work. Nobody should be talked into a purchase that only survives if everything goes right.
But if you can carry it, understand what waiting is actually buying you. You're choosing to transact later, in a crowd, against buyers whose borrowing power has just been restored, for stock that's sitting unsold today. You're also choosing to build later, in a trade market that'll be under the same pressure it was in 2021.
The deals being done right now are being done quietly, by people who have their finance sorted and have done the research, while the street is empty. That's what 85,000 unsold listings and a 49.5 percent clearance rate look like on the ground.
The market doesn't ring a bell. It gives you a quiet period with stock sitting and vendors negotiating, and then it takes that away over a single quarter. We've seen this playbook before.
If you want to work out honestly whether your numbers stack at 4.60 percent, and what they'd look like after two cuts, that conversation is free and it's the one worth having now rather than later. You can reach us through the contact page, or read more about how we work.
Common questions
Should I wait for interest rates to fall before buying property?
Will house prices go up when interest rates drop?
When will the RBA cut interest rates?
How much has borrowing capacity fallen in 2026?
Will building costs rise when the market recovers?
Are high interest rates actually fixing inflation?
Is it better to buy an established home or build right now?
Sources
- Reserve Bank of Australia, Cash Rate Target (4.60 percent effective 30 September 2026, after increases in February, March, May and September)
- Capital city listings and auction clearance reporting, four weeks to 30 August 2026 (new listings, total listings, days on market, clearance rates)
- Cotality, Home Value Index and historical series (2017 to 2019 national decline, the 2019 recovery, Brisbane annual growth)
- Borrowing capacity analysis, 2026 (approximately $47,400 or 9 percent reduction across four rate rises)
- APRA, serviceability buffer guidance and the debt to income limit effective 1 February 2026
- Australian Bureau of Statistics, Consumer Price Index (electricity, automotive fuel and food components, 2026)
- Australian Government, HomeBuilder programme data (more than 137,000 grants from June 2020)
- Construction cost and insolvency reporting, 2021 to 2024 (trade cost increases, construction share of insolvencies, dwellings under construction)
- Market pricing and major bank forecasts for the RBA cash rate, September 2026